

When evaluating a condominium purchase below 14th Street, one question tends to surface. Downtown condo prices are roughly where they were seven years ago. Does that represent a genuine entry point, or are there underlying reasons preventing prices from appreciating? The answer requires looking past the index — at the ownership profile, the supply history, and the mechanics of how this submarket absorbs and releases inventory.
What the Downtown Condominium Price Index Actually Shows
The downtown condominium price index — which tracks closed sales above $5 million below 14th Street — uses 2017 as its baseline of 100. In January 2018, the index stood at 124, meaning prices were running 24 points above that baseline. As of March 2026, the index sits at 99.
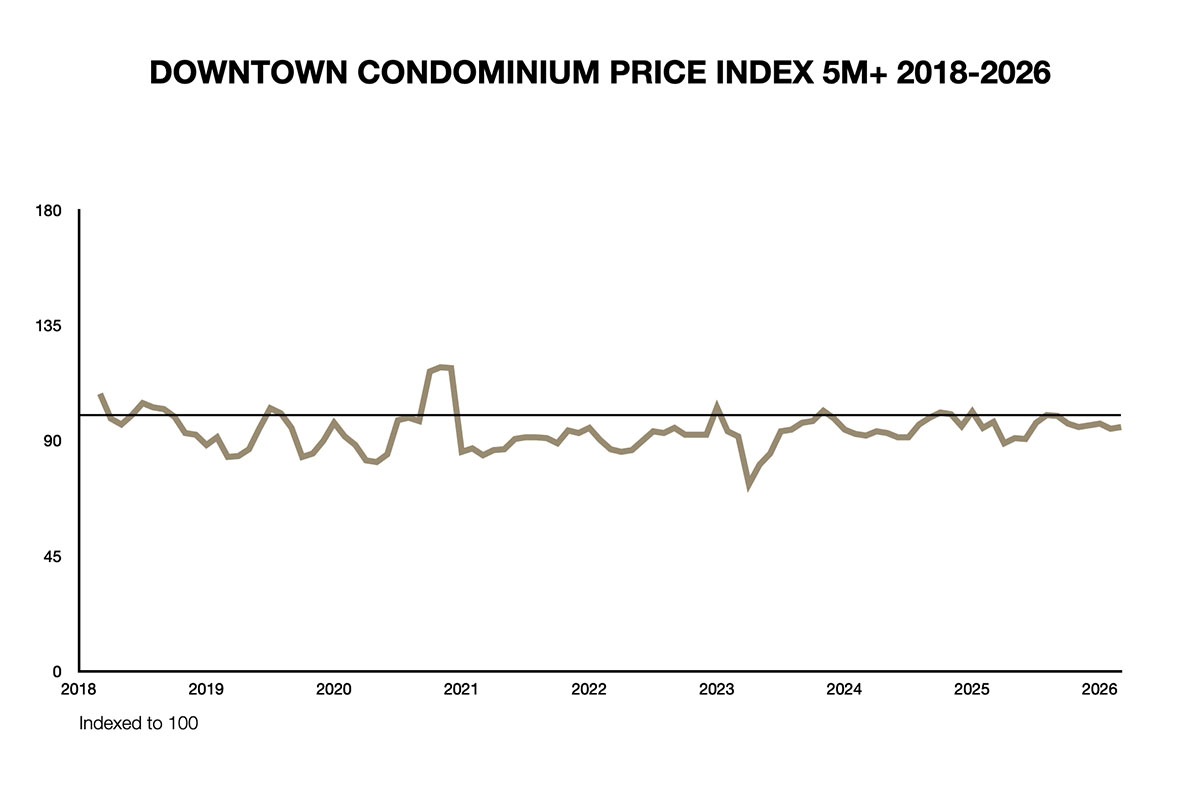
That is not a market in recovery. That is a market that peaked shortly after its baseline was set, declined, and has spent the better part of eight years oscillating in a range it has rarely crossed.
The annual averages tell the story without ambiguity: 2019 averaged 91, 2021 averaged 90, 2022 averaged 91, and 2025 averaged 96. The index has touched 100 in individual months but has not sustained it across a full calendar year since 2018. Notably, across the entire series from January 2018 through March 2026, the downtown $5M+ market did not record a single month without a qualifying closing — a consistency that speaks to the depth of buyer interest even through the plateau years.
What the index does show is a demand picture that makes the price plateau harder to explain on simple terms.
As of April 2026, the pulse ratio for the downtown $5M+ market — pending sales relative to available supply — stands at 0.42. The neutral range, where neither buyers nor sellers hold a meaningful advantage, runs from 0.20 to 0.30.
At 0.42, Downtown is well above neutral. Buyers are active, but prices have not followed.
Why the Plateau Has Persisted for Nearly a Decade
A Decade of Substitutable Supply
The explanation for the plateau begins with supply — not the absence of it, but the character of it.
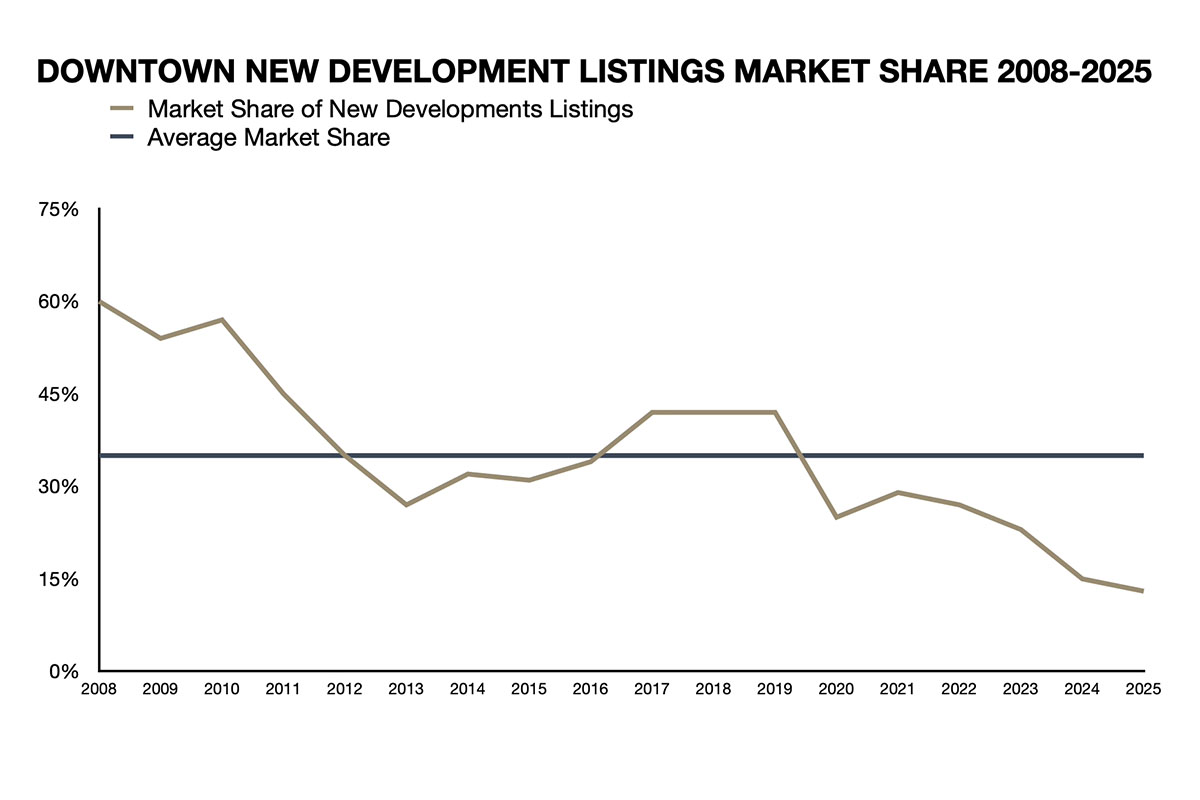
Between 2017 and 2019, new development listings accounted for 42 percent of all condominium inventory below 14th Street in each of those three consecutive years. In absolute terms, that meant more than 1,000 new development listings annually competing for the same buyer pool.
A $7 million buyer in Tribeca or SoHo during that period did not face a scarcity decision. They faced a selection decision — among sponsor units, resale units, investor-held inventory, and speculative flips, all broadly substitutable for one another at similar price points. When a market generates a continuous pipeline of near-equivalent options, it creates a pricing ceiling that demand alone cannot lift.
The pipeline has since contracted significantly. Downtown’s new development share fell from 42 percent in 2019 to 13 percent in 2025 — a 76 percent decline in absolute new development listings over six years.
But the contraction of new supply does not automatically dissolve the ceiling that the prior wave created. The resale inventory from that delivery cycle remains in the market — units purchased by investors during the peak years, now aging against newer product with better amenities, higher ceiling heights, wellness programming, and tax abatements the earlier buildings no longer carry.
A 2014 downtown condominium does not compete against the market that existed when it was purchased. It competes against what exists today. At the $5 million threshold and above, buyers are not rewarding good. They are paying for best. That distinction has kept the ceiling in place long after the delivery wave itself subsided.
The July 2019 mansion tax reform compounded the dynamic at exactly the wrong moment. A tiered rate replaced the prior flat rate, with the buyer’s burden rising to 3.25 percent on purchases above $10 million.
On a $10 million closing, the mansion tax obligation increased from $100,000 to $325,000 in a single legislative cycle — widening the bid-ask spread at exactly the price point this market concentrates on, at exactly the moment the supply wave peaked.
How the Investor-Held Segment Behaves Differently
The supply story explains the ceiling. It does not explain why the ceiling has held for nearly a decade after the delivery wave subsided. That requires understanding who owns the inventory that accumulated during the peak years — and why they have not sold.
Downtown’s development cycle attracted a variety of buyer profiles, one of them being investors capitalizing on the post-9/11 renaissance of Lower Manhattan, a transformation that was real and well-documented.
As the Financial District and Seaport became increasingly livable, drawing young professionals and the retail and infrastructure investment that followed, capital flowed into the submarket at a scale the end-use buyer pool could not ultimately absorb at the prices the investment thesis required.
These owners acquired units as financial assets tied to a neighborhood appreciation story, not as primary residences. That ownership profile behaves differently under carrying cost pressure than the end-use buyer who purchases a home and holds it through market cycles.
That behavior creates a shadow supply overhang. Units that are technically available — listed, or listable on short notice — do not clear the market because their owners are unwilling to accept prices that reflect the current market reality.
The result is a market where transaction volume exists, where the pulse ratio signals genuine demand, but where the price discovery mechanism is impaired by a large cohort of holders whose cost basis and return expectations were set during a cycle that has not repeated.
The COVID-19 pandemic accelerated two dynamics that were already present. It briefly surfaced investor-held inventory as owners who had acquired units for periodic New York use found themselves unable or unwilling to carry costs on properties they could not access. And it validated the migration of mobile capital to competing markets — Miami in particular — that had been underway before the pandemic made it visible.
The buyers who left were not the end-use buyers whose demand the pulse ratio now reflects. They were the investor class whose ownership had concentrated in exactly the downtown submarket this analysis covers.
Why Two High-Demand Submarkets Have Diverged
The most precise way to isolate the underlying causes of the plateau is to compare downtown against a submarket competing for the same buyer. The Upper East Side offers that comparison — similar demand, different price performance, and a supply history that is not comparable at all.
As of April 2026, the pulse ratio for the Upper East Side $5M+ market stands at 0.63 — compared to 0.42 for downtown. Both are well above the 0.20 to 0.30 neutral range.
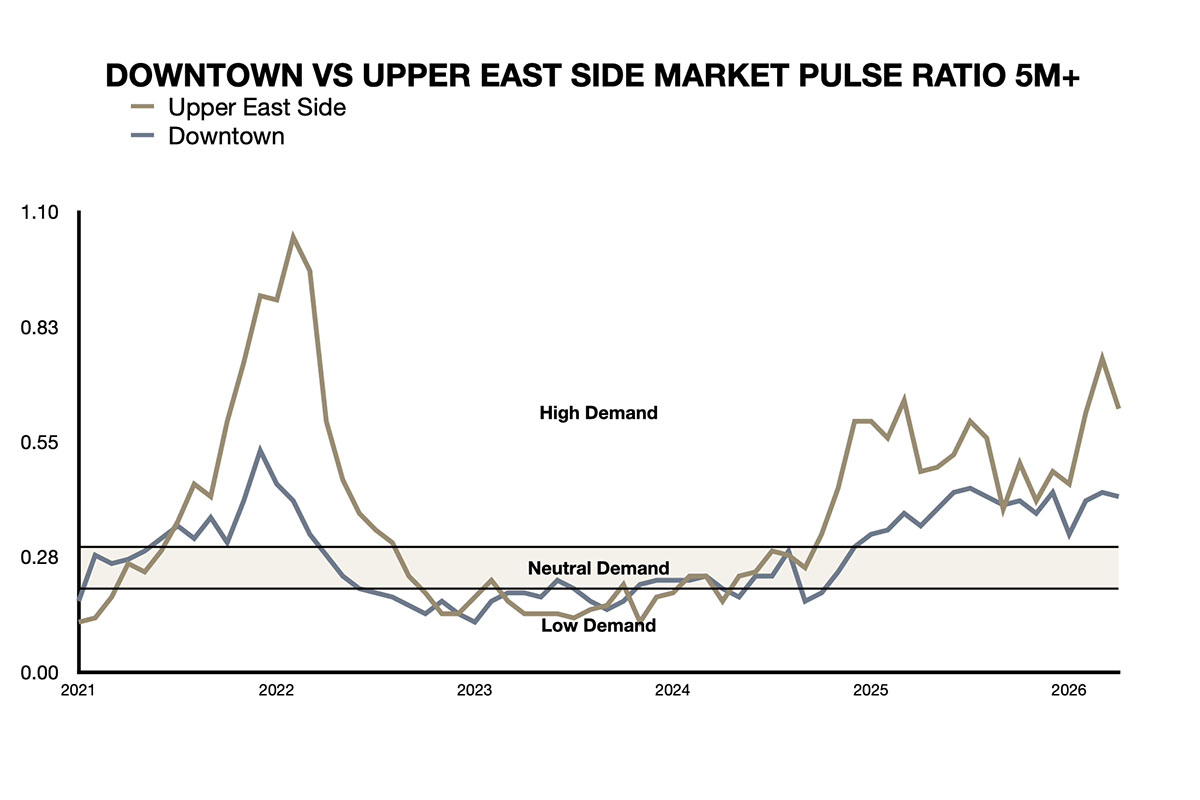
The Upper East Side is running at a level that reflects genuine seller’s market conditions at the top of the market. Downtown is strong but has not reached that threshold. The demand differential is real, but it is not large enough to account for the price divergence on its own.
The Upper East Side’s price index has recovered and exceeded its 2017 baseline. Downtown’s has not. Understanding why requires looking at what is different between them — not at the demand side, where both markets are active, but at the supply side, where they are not comparable at all.
Between 2017 and 2019, new development accounted for 42 percent of downtown condominium inventory annually. Over the same period, the Upper East Side’s new development share ranged between 18 and 28 percent — and that inventory competed against a fundamentally different resale base.
The Upper East Side is built around scarcity: the most coveted locations — Fifth Avenue, with direct Central Park frontage — are dominated by prewar co-operative buildings whose boards control transfer, whose units rarely trade, and whose ownership profile reflects generational wealth rather than investor capital.
Landmark designation constraints restrict new construction throughout much of the neighborhood, and the condominium inventory that does exist competes against a resale base that long-duration owners are in no hurry to sell. When demand increases in that environment, it encounters fewer substitutes. Prices respond.
Downtown offered the opposite condition during the same years. More inventory, more substitutable options, more investor-held units available to meet demand without requiring price discovery at higher levels. The scarcity premium that drives sustained appreciation was absent.
The liquidity comparison between the two submarkets adds one more dimension. The Upper East Side recorded six months across the same period with no qualifying closing above $5 million. Downtown recorded none. That consistency is a genuine characteristic — a market deep enough to transact continuously. But as the divergence in price performance makes clear, liquidity and appreciation are not the same condition. Downtown’s consistent transactability is partly a function of the same substitutability that has suppressed its pricing power.
For a buyer whose situation includes a defined exit horizon, the liquidity advantage is not incidental. It simply does not substitute for the scarcity dynamic that has driven appreciation on the Upper East Side.
What Would Move Prices Sustainably Above the 2017 Baseline
The conditions that produced the plateau are deeply rooted. The conditions that would end it are equally so — and they are not the same as a general increase in market activity or a reduction in interest rates.
The pulse ratio already reflects strong demand. What the market has not yet produced is the combination of conditions that would translate that demand into sustained price recovery.
Three things would need to happen, likely in sequence.
The first is continued absorption of the investor-held shadow inventory. The units acquired during the post-9/11 renaissance thesis need to clear the market — through sale, through conversion to long-term rental, or through a carrying cost calculation that eventually forces a pricing decision.
That process is underway but incomplete. Rising common charges, the end of 421-a tax abatements on buildings that benefited from them, and the general increase in the cost of holding unoccupied residential property in New York City are all applying pressure to marginal holders.
The question is whether that pressure is sufficient to accelerate the clearing, or whether holders continue to wait for a recovery that the ceiling prevents.
The second condition is genuinely differentiated new product. The downtown new development share has fallen from 42 percent in 2019 to 13 percent in 2025 — the pipeline that created the substitutable supply overhang has materially contracted.
But the absence of new supply is not the same as the presence of scarcity. What would move prices is not simply fewer units, but the arrival of product that is irreplaceable rather than merely new — buildings whose location, design, or programmatic identity cannot be found elsewhere below 14th Street.
That product, when it arrives, will not be priced at current index levels. It will establish a new ceiling. Whether it pulls the broader market upward depends on how much of the existing inventory it renders obsolete rather than substitutable.
The third condition is a shift in the ownership profile. The investor capital that dominated the peak years needs to be replaced by end-use buyers — primary residents, families, buyers whose holding period is measured in decades rather than market cycles. That shift is also underway.
The pulse ratio trajectory from 0.23 in 2024 to 0.42 in April 2026 reflects genuine end-use demand returning to the submarket. But the price index has not yet confirmed it, which suggests the shadow inventory overhang is still absorbing demand before it reaches the price discovery mechanism.
One legislative variable deserves attention without overstating what is currently known. A pied-à-terre tax on non-primary residences valued above $5 million has been proposed by Governor Hochul and Mayor Mamdani and included in budget negotiations as of May 2026. The rate has not been finalized.
Whether the $5 million threshold refers to market value or assessed value has not been resolved — a distinction that is not minor, given the gap between the two in many downtown buildings. The legislation has not been enacted. What the current proposal specifies is that units offered for rent would be exempt — the tax targets vacant second homes, not income-producing investment property.
To the extent that the downtown shadow inventory includes units held vacant rather than rented, the proposal introduces a carrying cost calculation that could accelerate the decision to sell. How many units that describes, and at what price points, depends on details the state has not yet provided.
What the Index Cannot Tell a Specific Buyer
The index tells you where prices are. It does not tell you whether this moment serves a specific buyer’s situation.
A buyer acquiring below 14th Street as a primary residence, with a long holding period and no near-term exit requirement, is looking at a market where prices are at their 2017 baseline, demand is strengthening, the investor-held overhang is slowly clearing, and the new development pipeline that created the substitutable supply ceiling has contracted by 76 percent over six years. That combination of conditions reads differently than the index alone suggests.
A buyer acquiring as a secondary residence, with a shorter horizon or a capital structure that requires the asset to perform within a defined timeframe, is looking at the same index but a different set of questions.
How much of the shadow inventory has actually cleared? How does the proposed pied-à-terre legislation interact with their specific ownership situation? How does the liquidity profile of this submarket — consistent but not deep — interact with the exit they may eventually need?
A family office evaluating the purchase on behalf of a client whose real estate decision sits inside a broader estate or capital arrangement is looking at something different still. The asset’s recovery profile is rooted in the mechanics of supply absorption rather than cyclical correction, which means it does not respond to the same inputs as a market downturn.
Timing a supply-driven recovery requires a different analytical framework than timing a cyclical one — and the index, by itself, provides neither.
What the current price level represents for a specific buyer depends on how they intend to use the property, what their time horizon is, and how the asset’s particular recovery profile interacts with everything else their situation requires. The index cannot resolve that. The data in this analysis cannot resolve it either.
Key Considerations
Downtown condominium prices above $5 million have not sustained a recovery above their 2017 baseline in any full calendar year since 2018, despite a pulse ratio of 0.42 as of April 2026 — well above the 0.20 to 0.30 neutral range. The plateau is not a demand story: it is the product of a decade of substitutable supply, an investor-held ownership profile whose cost basis and return expectations were set during a cycle that has not repeated, and a scarcity deficit that distinguishes downtown from submarkets where appreciation has been sustained. The conditions that would move prices above baseline require the absorption of shadow inventory, the arrival of genuinely irreplaceable new product, and a shift toward end-use ownership — all of which are underway but incomplete. A proposed pied-à-terre tax targeting vacant second homes above $5 million adds an unresolved variable whose rate, assessment basis, and effective date remain unconfirmed. What the current price level represents for a specific buyer depends on intended use, time horizon, and how the asset’s recovery profile interacts with their broader situation.